.svg)
A Tale of Two Hospital Markets: New Haven and Washington, D.C.
.webp)

Hospital consolidation is reshaping health care in communities across the country. Over the past 20 years, there have been around 1,300 mergers among the nation's approximately 5,000 hospitals. The hospital industry, which accounts for approximately 30% of all health care spending, has experienced more price growth during that time than virtually any other sector of the economy.
Research has shown that hospital mergers are an important driver of rising health care spending, and that many hospital mergers push up health care prices and result in job losses among middle-income workers in the region.
But importantly, not all communities across the country have experienced an increase in hospital consolidation, and not all hospital mergers result in higher prices.
To help policymakers and consumers understand the geography of hospital consolidation across the U.S., the Health Care Affordability Lab at Yale created a new tool that helps users explore the impacts of thousands of hospital mergers, closures, ownership changes, and rising market concentration over the last few decades.
In order to measure concentration, our tool defines markets based on a 30-minute travel time. This definition reflects our best effort to approximate a reasonable choice set for patients and does not necessarily represent the relevant market for antitrust enforcement.
Anyone can use the tool to examine how the HHI of a specific hospital or health system has changed over time. Looking at individual hospitals, 55% of U.S. hospitals experienced an increase in their HHI of 100 or more points between 2000 and 2025. 16% were consistently in monopoly markets, while 29% of hospitals did not experience a significant increase in their HHI.
What’s a “Red Zone Merger”?
Some mergers are more problematic than others, but most that have occurred in the last quarter century resulted in a more concentrated hospital market. Our tool highlights transactions deemed “Red Zone Mergers.” These are mergers that, according to the Department of Justice and Federal Trade Commission guidelines, are likely to raise prices by lessening competition based on the change in market concentration they generate.
The tool relies on the Herfindahl–Hirschman Index (HHI)—a standard antitrust metric—as a measure of market concentration. HHIs range from 0 (many small competitors, highly competitive) to 10,000 (a monopoly).
Red Zone Mergers are those that produce a post-merger HHI above 1,800 via an increase of more than 100 points. These thresholds align with federal antitrust benchmarks used to identify potentially anticompetitive mergers. Between 2000 and 2025, 32 percent of hospital mergers were within the Red Zone.
A tale of two cities: New Haven, Connecticut and the District of Columbia
The market concentration of hospitals throughout Connecticut has increased significantly in the past 25 years. In the New Haven region, Yale New Haven Health System has driven much of this change.
Yale New Haven Health
In 2000, Yale New Haven Health System was a 1,264-bed, three-hospital system. Two of the hospitals in the system were in highly concentrated markets, with HHIs over 3,400. By 2025, Yale New Haven Health System had grown to a 2,974-bed system with seven hospitals, five of which have HHIs exceeding 6,500.
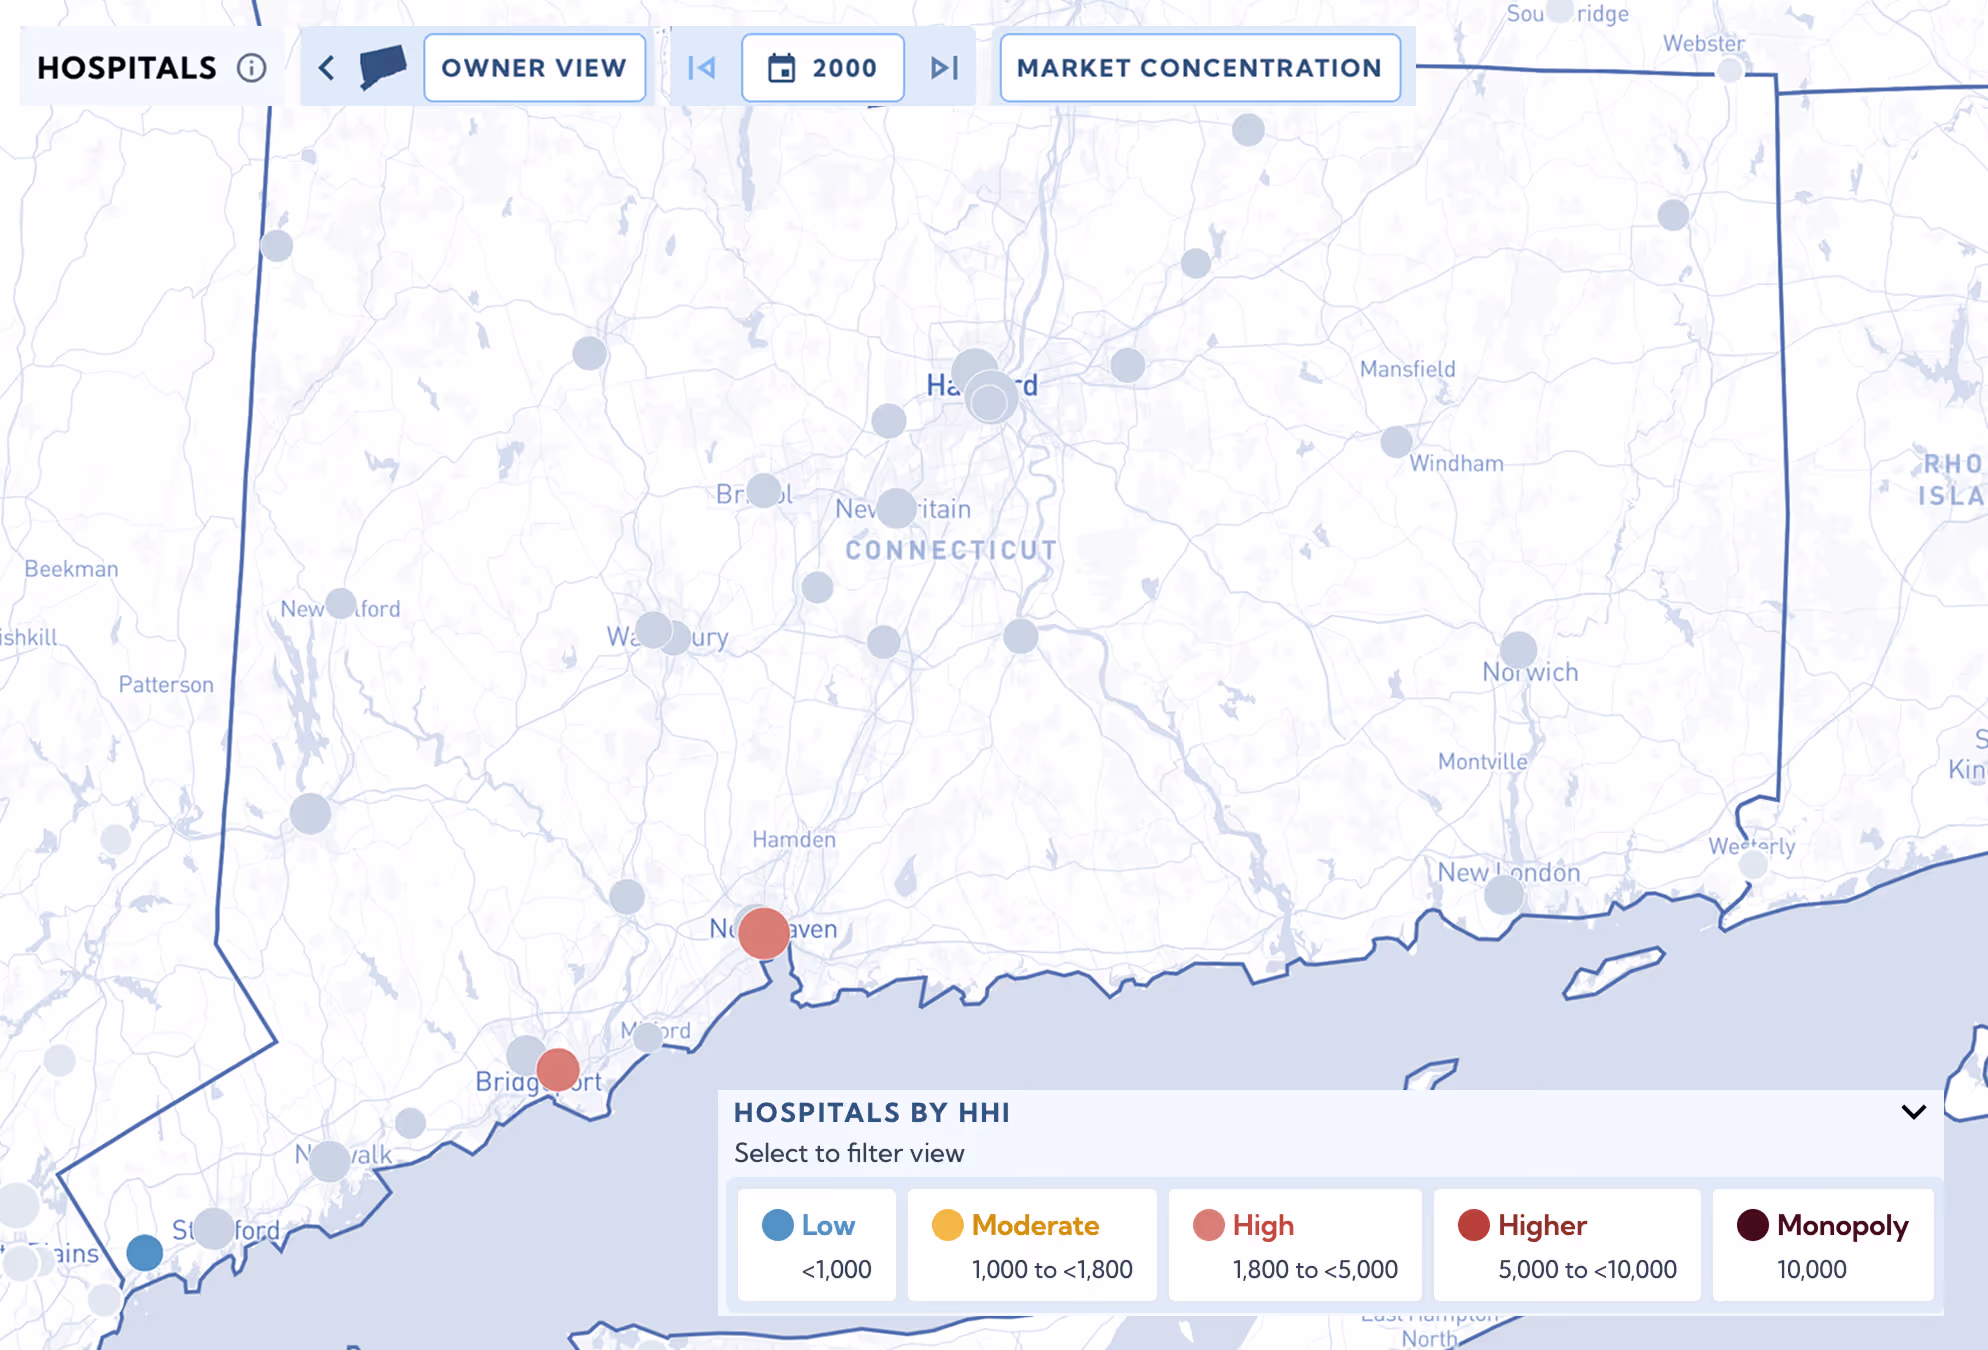

Two of the four transactions—the acquisitions of St. Raphael Hospital (2012) and Milford Hospital (2019)—that grew Yale New Haven Health System were considered Red Zone Mergers.
In 2012, Yale New Haven Health System acquired a second New Haven-based hospital—St. Raphael. This transaction increased the market concentration of St. Raphael Hospital and Yale New Haven Hospital by 1,854 points each. It increased the concentration of Bridgeport Hospital by 2,003 points. Following the transaction, three of Yale New Haven’s four hospitals had HHI levels of over 5,500 points.


In 2016, Yale New Haven Health System acquired two more hospitals: Lawrence + Memorial Hospital in New London, Connecticut, and Westerly Hospital in Rhode Island. Notably, these transactions decreased the HHI levels of each of those hospitals. However, each hospital already had an HHI of over 5,200 points, which brought two additional “higher” concentration hospitals into the Yale New Haven Health System.
Yale New Haven Health System’s most recent acquisition—of Milford Hospital—occurred in 2019. The transaction raised the HHI of Milford Hospital by 590 points and led to a post-merger HHI of 6,547—a Red Zone Merger.
Connecticut
Throughout this period, the state of Connecticut has maintained the same number of hospitals (32 total), but due to changes in hospital ownership, the hospital market has become significantly more concentrated. In 2000, 32 Connecticut hospitals had 26 different owners, which included 4 health systems and 22 independently owned hospitals. In 2025, there were still 32 hospitals, but only 11 unique ownership entities: 5 health systems and 6 independently owned hospitals.
In 2000, two Connecticut hospitals were in markets with HHI levels higher than 5,000, indicating that one hospital system dominated the majority of the market. In 2025, 13 Connecticut hospitals were in markets with HHI levels higher than 5,000. Likewise, seven of 22 mergers in Connecticut between 2000 and 2025 were considered Red Zone Mergers.
>> Investigate Connecticut in the Market Explorer<<
District of Columbia
The District of Columbia (D.C.), in contrast, has maintained a significantly less concentrated hospital market. In 2000, seven hospitals with six different owners (4 health systems and 2 independently owned hospitals) were located in D.C. In 2025, D.C. has six hospitals with five owners (3 health systems and 2 independently owned hospitals). D.C. had just one merger, in 2010, which was not considered a Red Zone Merger.
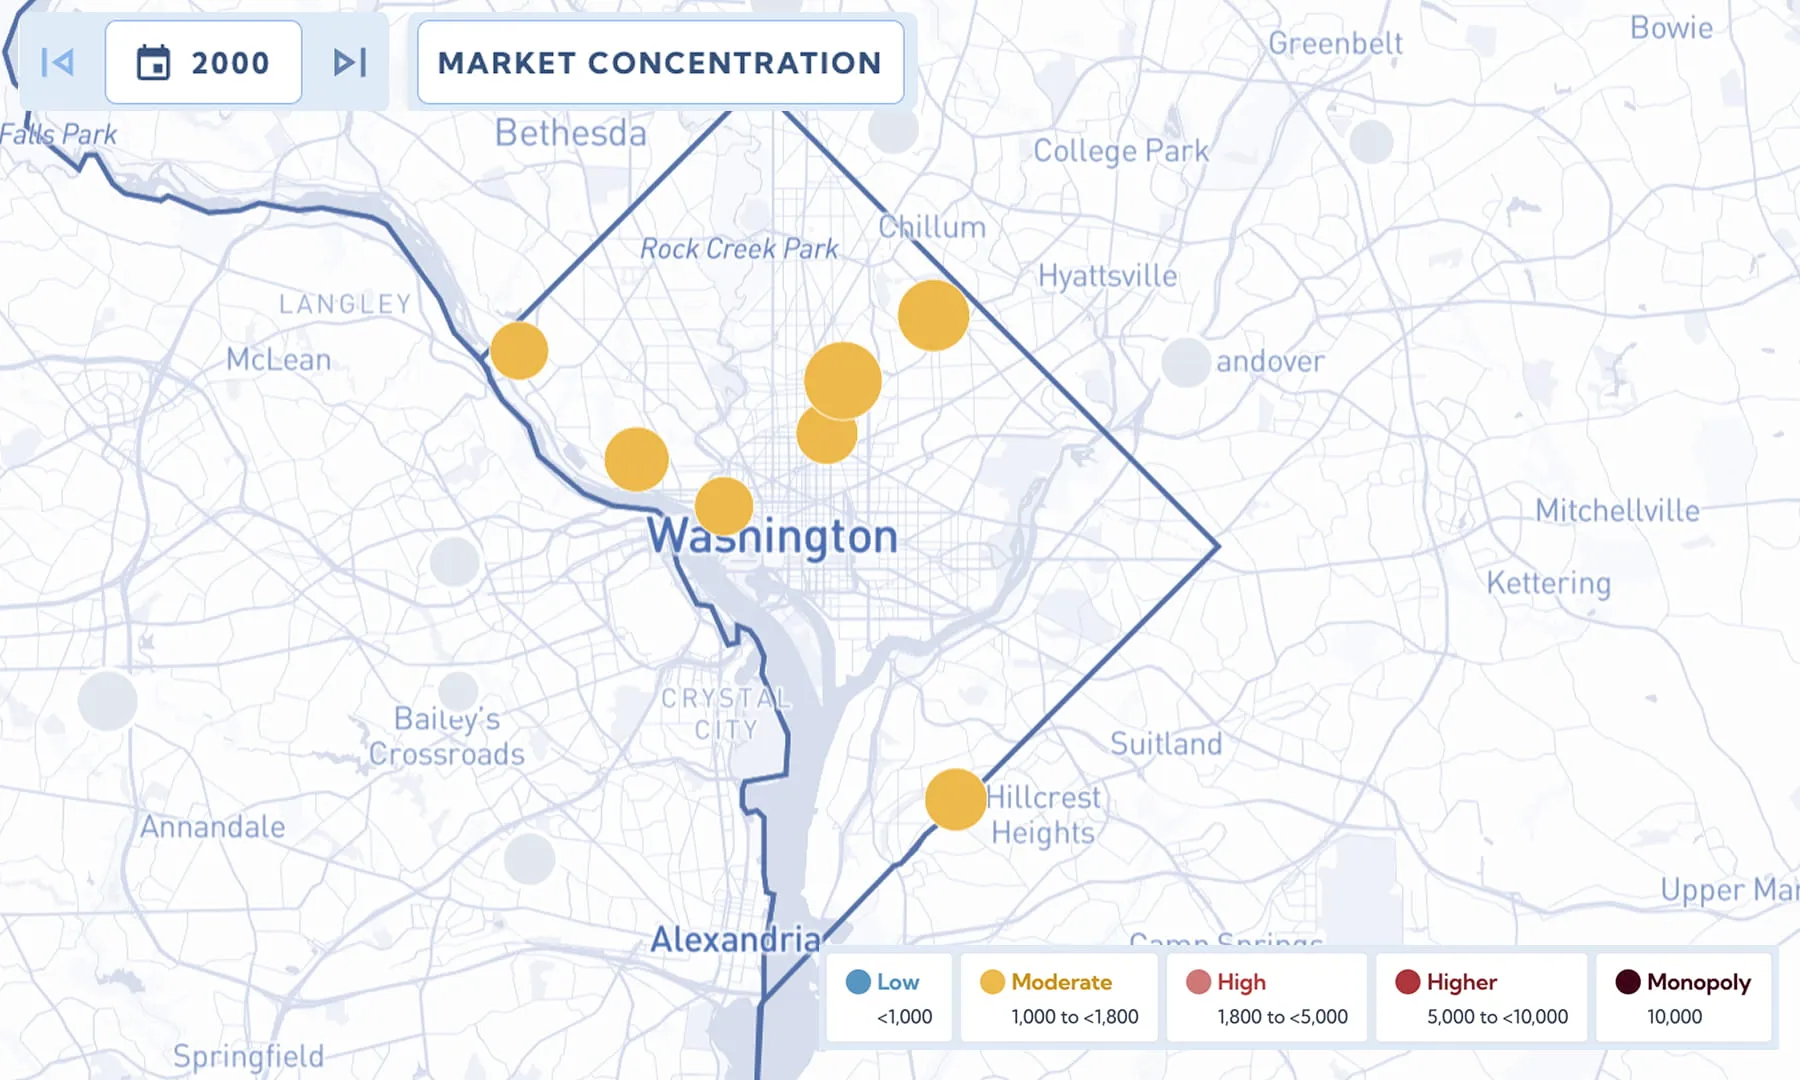
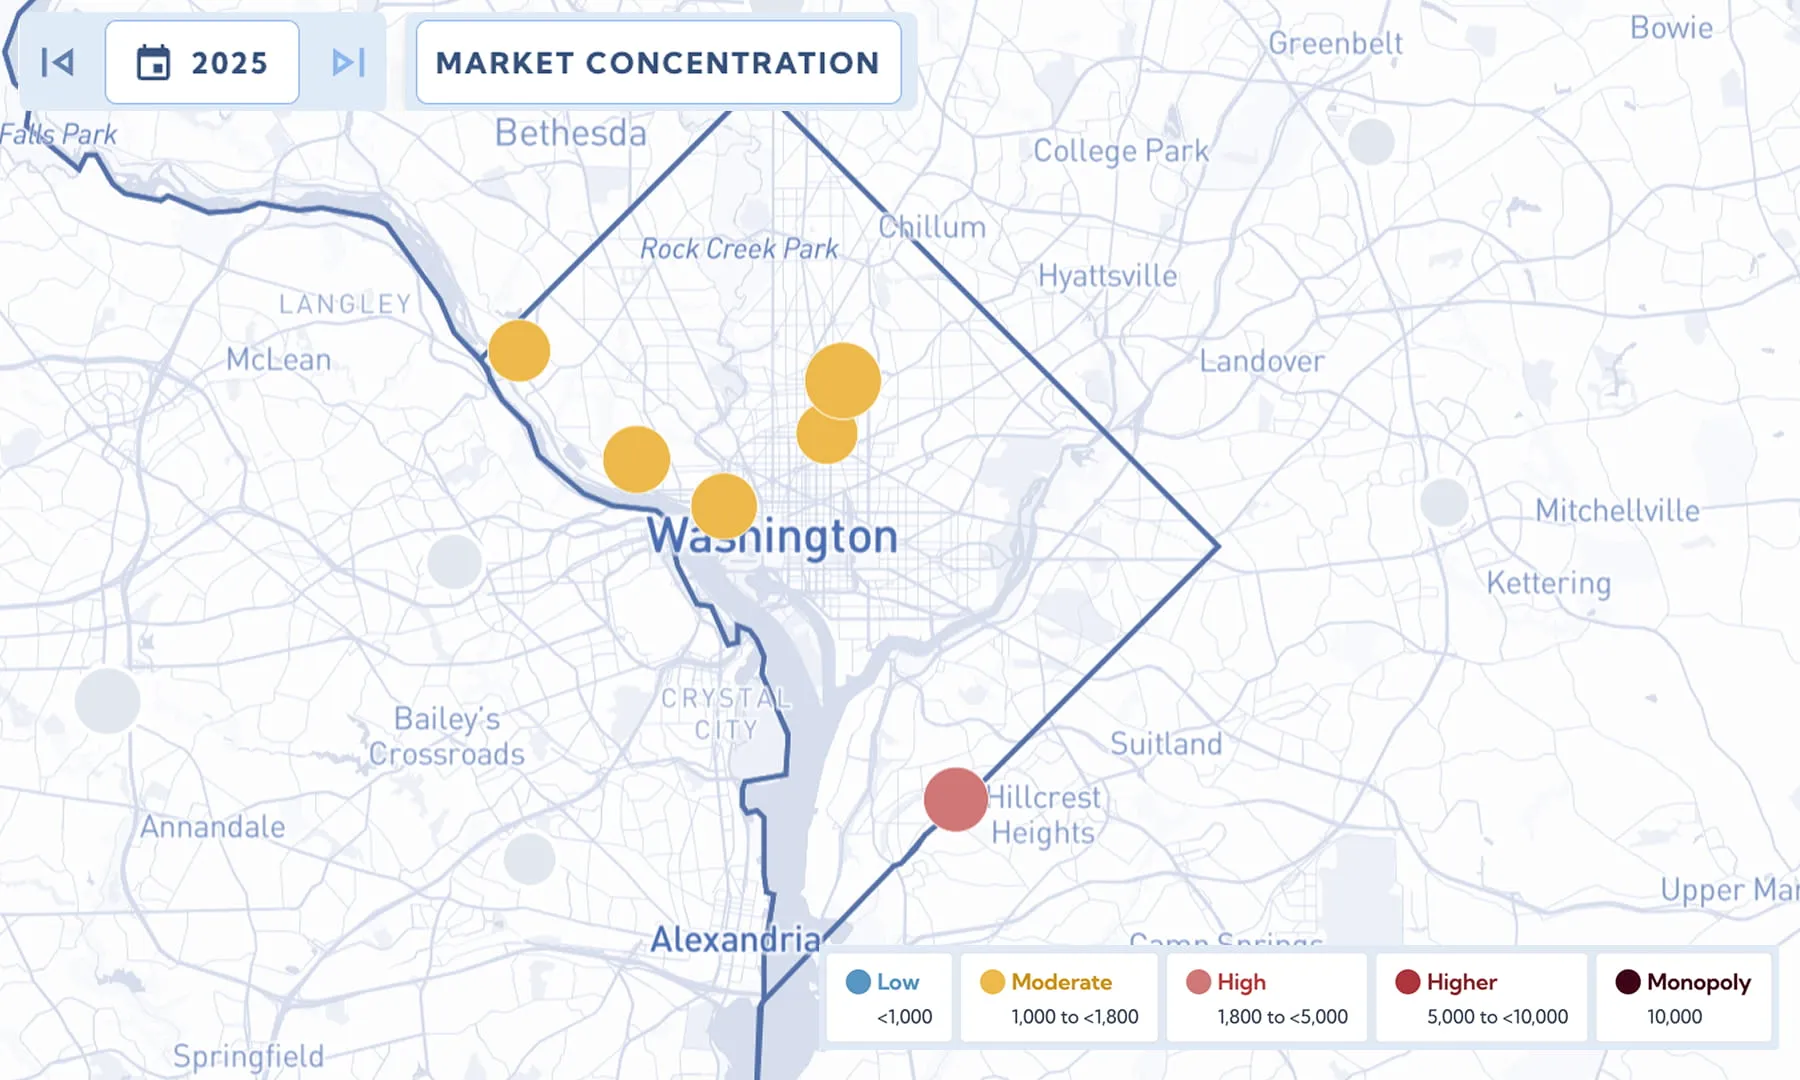
In 2000, D.C.’s average hospital market HHI was 1,329 and all hospitals were considered in “moderate” concentration markets. By 2025, D.C.’s hospital market concentration grew 280 points to 1,609, with one hospital considered in a “high” concentration market and five in “moderate” concentration markets.
>> Investigate D.C. in the Market Explorer<<
Explore hospital market concentration in your community
Our tool has data on over 1,300 transactions among approximately 5,000 hospitals over 25 years.
To learn more about hospital market consolidation in your community, explore the data in the new interactive from the Health Care Affordability Lab at Yale.

.webp)
More Commentary

Where America's Hospitals Are Closing — and Opening
Just the Facts on Health Care Consolidation