.svg)
A New Tool For Understanding Hospital Consolidation in Your Community
.webp)

The $1.6 trillion U.S. hospital sector accounts for the plurality (31%) of domestic health care spending and 6% of the Gross Domestic Product. Since 2000, prices in the hospital sector have grown faster than prices in nearly any other sector of the U.S. economy. In 2024, hospital prices grew by 3.4 percent, the highest increase since 2007.
One major and underappreciated factor driving health care spending and price growth is consolidation in the hospital sector. Since 2002, there have been well over 1,300 mergers among the nation's approximately 5,000 hospitals. During that period, the FTC took enforcement action against just 13 of those transactions.
The stakes of this consolidation are high: research shows that when hospital mergers raise prices, health spending and insurance premiums increase. When insurance premiums go up, it becomes more costly for companies outside the health sector to retain workers, and this leads to increases in unemployment. The jobs lost when hospital prices rise are concentrated among workers earning less than $100,000 a year.
A new tool from the Health Care Affordability Lab at Yale
A new tool from the Health Care Affordability Lab at Yale allows users to explore how hospital mergers, closures, ownership changes, and rising market concentration are reshaping U.S. hospital markets and potentially driving up prices.
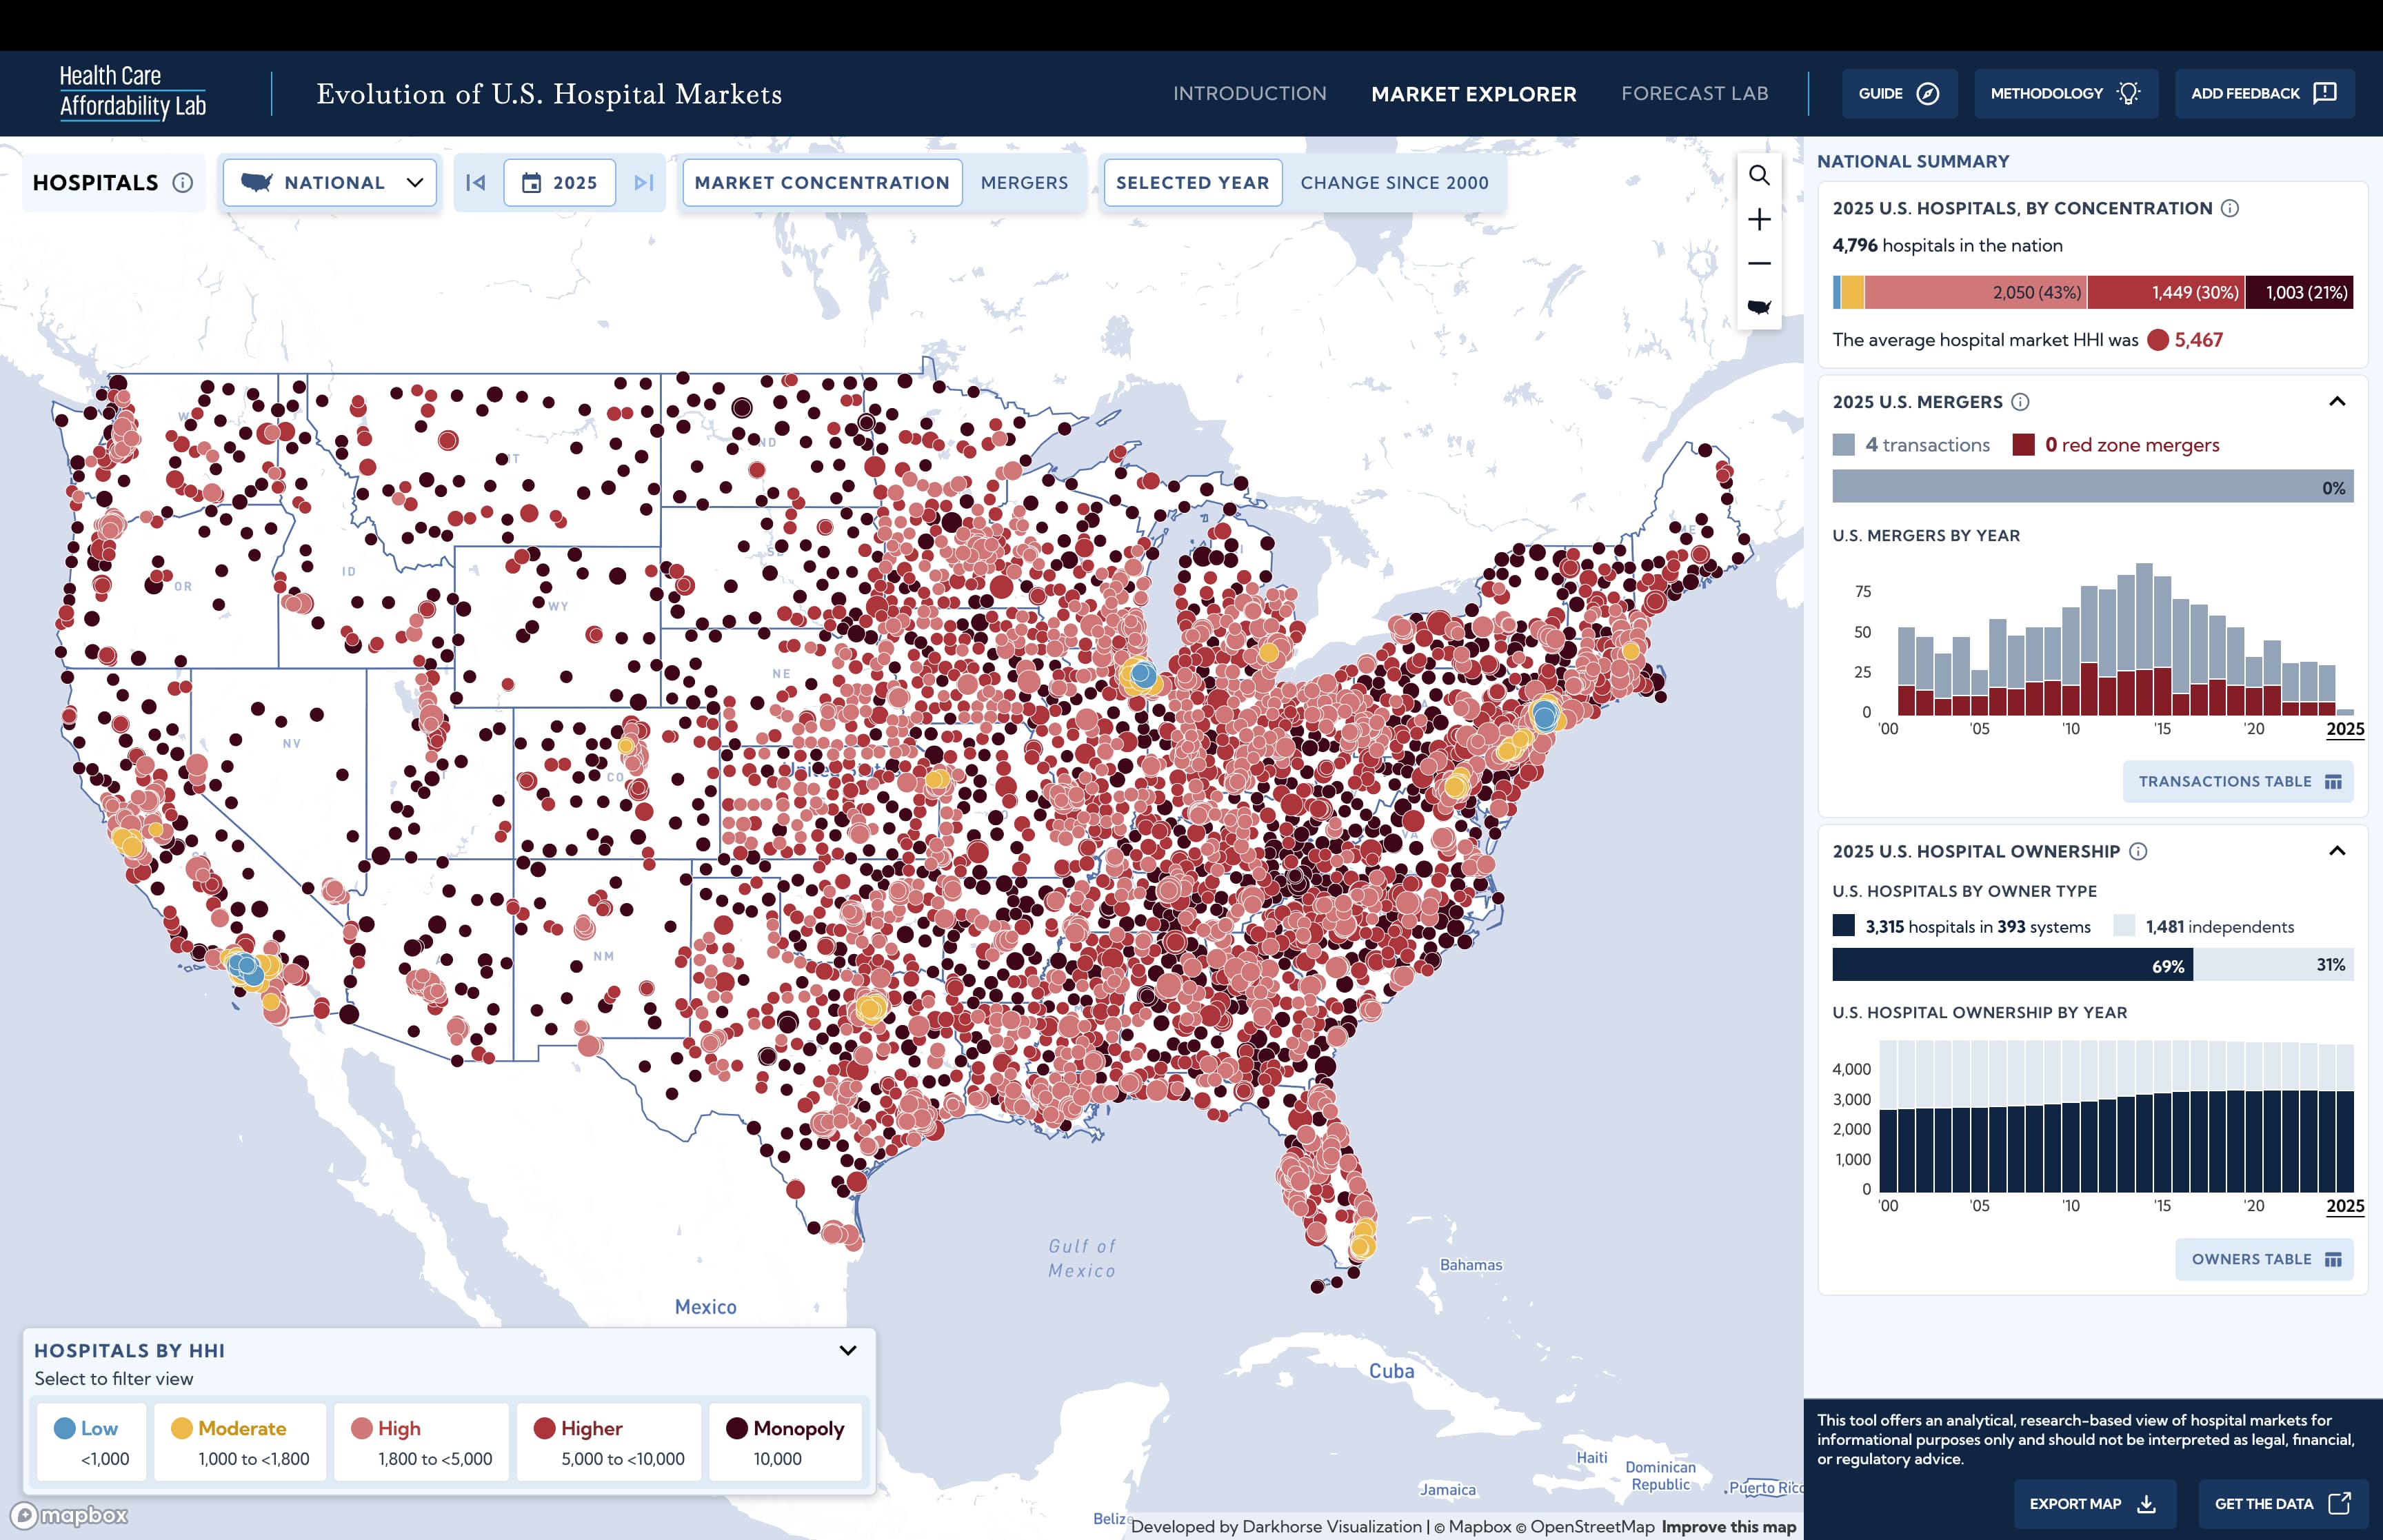
To identify communities exposed to meaningful reductions in competition in hospital markets, the tool highlights transactions deemed “Red Zone Mergers.” These are mergers that, according to the Department of Justice and Federal Trade Commission guidelines, are likely to raise prices by lessening competition.
The tool calculates the Herfindahl–Hirschman Index (HHI)—a standard antitrust measure of market concentration—for all general acute care hospitals in the U.S. HHIs range from 0 (many small competitors, less concentrated) to 10,000 (a monopoly). Red Zone Mergers are those that produce a post-merger HHI above 1,800 via an increase in HHI of more than 100 points. Between 2000 and 2025, 32 percent of hospital mergers were within the Red Zone.
In order to measure concentration, our tool defines markets around each hospital based on a 30-minute travel time. This definition reflects our best effort to approximate a reasonable choice set for patients and does not necessarily represent the relevant market for antitrust enforcement.
What you can do with the tool
This tool will help policymakers and consumers at the federal, state, and local level better understand how hospital market concentration is shifting in the communities they care about.
Here are a few things you can do with the tool:
See how hospital market concentration has changed over time in each community in the U.S.
Over the last two decades, more than half of hospitals experienced an increase in concentration in the market where they operate.
The market for hospital care in New Haven, Connecticut typifies this trend. In 2000, the Yale New Haven Health System was a three-hospital system. Two of its hospital sites were in highly concentrated markets, each with HHIs over 3,400. By 2025, the Yale New Haven Health System had grown to encompass seven hospitals, five of which have HHI levels exceeding 6,500 (reminder: an HHI of 10,000 would indicate a hospital is a monopolist in its market).
The District of Columbia (D.C.), in contrast, has maintained a significantly less concentrated hospital market. In 2000, D.C. had seven hospitals with six different owners, with an average hospital market HHI of 1,329. By 2025, D.C. has six hospitals with five owners, and an HHI that had grown by only 280 points.
Read about the evolution of hospital markets in New Haven and D.C.>>
See which hospitals exist in highly concentrated or monopoly markets.
HHIs capture the relative concentration of hospital markets—the extent to which a small number of competitors have high market share. In general, prices tend to be higher in more concentrated markets. Our tool reveals which hospitals are located in concentrated markets and which markets have become more concentrated over time.
Anyone can use the tool to compare hospital concentration across the country. With 100% of their hospitals in markets considered highly concentrated or monopoly markets, Wyoming, North Dakota, and South Dakota have the most concentrated hospital markets of any states in the U.S. D.C., Rhode Island, New Jersey, and California have the lowest proportion of hospital markets considered highly concentrated.
See hospital market concentration in all 50 states >>
Simulate a pending or potential hospital merger, closure, or divestiture and see how it impacts market concentration
Our new tool can help policymakers and interested residents see how a proposed merger in their area will impact market concentration. Our researchers have analyzed several potential mergers—from Indiana to Washington state to West Virginia—under consideration right now to highlight how the tool works.
Read more about six mergers and transactions to watch >>

.webp)
More Commentary

Where America's Hospitals Are Closing — and Opening
Just the Facts on Health Care Consolidation